THIS ARTICLE IS MORE THAN FIVE YEARS OLD
This article is more than five years old. Autism research — and science in general — is constantly evolving, so older articles may contain information or theories that have been reevaluated since their original publication date.
A new algorithm can simultaneously delineate a neuron’s shape and position as well as its firing pattern by tracking the flow of calcium. The tool, described 20 January in Neuron, may help researchers easily interpret activity in large batches of neurons1.
When neurons fire, calcium ions flood their interiors. By tracking this influx with fluorescent markers, researchers can infer patterns of neuronal activity in the brains of mice and other animals.
But when neurons connect in a dense and tangled network, it can be difficult to discern where one cell ends and another begins. What’s more, the fluorescent signals rise and fall slowly, making it hard to tell when an actual firing event occurs.
Researchers have devised various algorithms to sidestep these problems one at a time. The new program offers a streamlined solution, simultaneously outlining the boundaries of individual neurons and translating the cleaned-up data into a meaningful record of neuronal activity.
Sketching cells:
To develop the algorithm, researchers first made a computer model of calcium flow and firing in groups of neurons, based on existing knowledge. Their algorithm matches that model to data from videos of calcium flow in specific neuronal cultures or pieces of living tissue, to estimate the locations and firing patterns of the cells.
The new algorithm determines the cells’ positions and firing patterns simultaneously by letting the two measures inform each other. Maps of electrical activity can help the algorithm better gauge neurons’ boundaries, and vice versa.
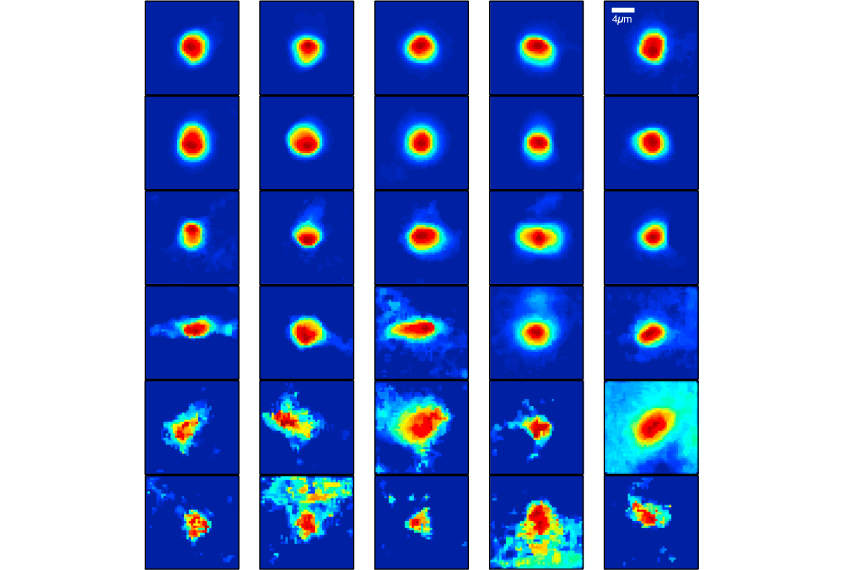
The researchers applied the algorithm to real calcium imaging data from a mouse brain and a zebrafish brain, mapping calcium dynamics in the cell bodies. They also looked at only the signal-receiving tips of a different set of mouse neurons, tracing the many branches of each neuron and measuring its activity. They showed that the algorithm can generate clear results from various types of imaging data.
The method should allow researchers to reliably interpret calcium imaging data for large groups of neurons. Autism researchers could use the technique to better understand how groups of neurons form circuits and how these may be altered in autism.
By joining the discussion, you agree to our privacy policy.